Technical analysis is conduct by an analyst to study the price movements of stocks in the security market. An investor buys securities when there is an upward price movement and sells securities when there is a downward price movement.
Technical Analysis is the process of identifying trend reversals at an earliest stage to formulate the buying and selling strategy with the help of several indicators. It seeks to identify and exploit price patterns and market trends in the financial markets.
Assumptions of Technical Analysis:
- The market value of the script is decided by the market forces of demand and supply
- Market discounts everything
- The market always follows a trend except minor deviations
- History repeats itself
DOW Theory
Technical Analysis is based on the doctrine given by Charles H Dow in the year 1884 in wall street journal. He developed the Dow Theory to explain the movement of indices of ‘Dow Jones Averages’ on the basis of the following assumptions:
- No single individual can influence the major trends in the market
- Market discounts everything
- Theory is not infallible
According to Dow Theory, the market trend can be divided into three trends namely:
- Primary trend (1-2 years) which is interrupted by
- Intermediate trend (3 weeks to 3 months) (these are corrective movements)
- Tertiary (Short Term) trend (day to day price fluctuations)
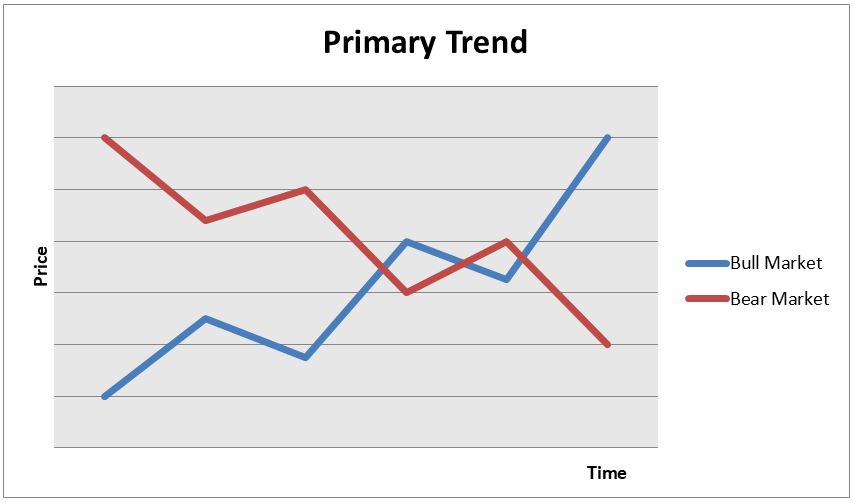
• Primary Trend: The security price trend may be either increasing or decreasing. When the market exhibits increasing trend, it is a bull market that shows three clear peaks. Each peak is higher than previous peak and each bottom is also higher than the previous bottom. The trend following the peak halts for some time, reaches the bottom and then rises again.
The three peaks form three unique phases which signifies:
- Phase I – Revival of corporate confidence/market confidence
- Phase II – Good Corporate Earnings
- Phase III – Price increase due to Inflation and Speculation
The reverse of the bull market is bear market. It is the period when the prices of shares are falling. In a bear market the three downward sloping peaks and bottoms signify:
- Phase I – Loss of hope – People lose confidence and start selling shares
- Phase II – Recession in business, Low dividends, Low profits
- Phase III – Distress selling
• Intermediate trend/Secondary Trend – It moves against the primary trend and the deviation is usually corrected automatically. In the bull market an intermediate trend can result in a downward trend of 33% to 66%, while in a bear market it would result in an upward trend of 33% to 66%.
• Short Term Trend – These are random wriggles or minor trends that correct the movement of the secondary trend. They represent the day to day price fluctuations in the market.
https://en.wikipedia.org/wiki/Support_and_resistance
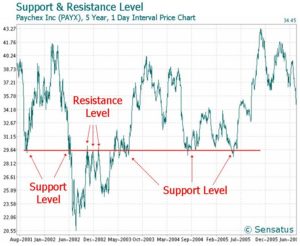
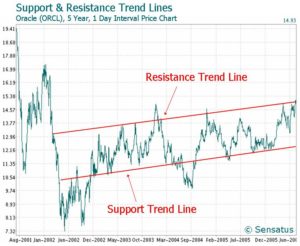
• Support and Resistance level – When price of a share is moving in an upward trend it will peak again and again at a certain price level and will not rise above that level known as the resistance level due to excess supply of scrip over demand. Support level is the opposite. It is the level beyond which the share price will not fall as the demand for scrip is greater than its supply.
Technical Indicators of the market
Technical Indicators give a holistic view of the market and help to determine the behaviour and direction of the market.
• Volume of Trade – Usually the, volume of trade expands in the bull market and contracts in the bear market. However, a large rise or fall in prices leads to a sudden increase in volume of trade. An investor must worry if the volume falls with rise in prices or vice versa as such a trend may not prevail for a long time. A large volume with rise in prices signifies a bull market while large volume with fall in prices indicates the bear market.
• Breadth of the Market – It is used to study the advances and declines in the stock market. Advances refer to a price increase in shares from its previous trading day while declines indicate a fall in prices of shares from its previous trading day. The net difference between the advances and declines in a particular period is the breadth of the market.
• Short Sales – It is selling of shares that are not owned. Short sellers sell shares now and hope to purchase it at a lower price in the future to make profits.
• Odd Lot – Shares sold in a lot that is less than 100 are called an odd lot. An increase in odd lot trading leads to an increase in the index.